This City Just Got Named The Most Dangerous Place For US Drivers

  • Northeast cities have been named the most dangerous city for US drivers.
  • Boston was ranked worst, followed by Washington, Baltimore and Worcester.
  • Drivers in Brownsville and Boise are least likely to experience a collision.

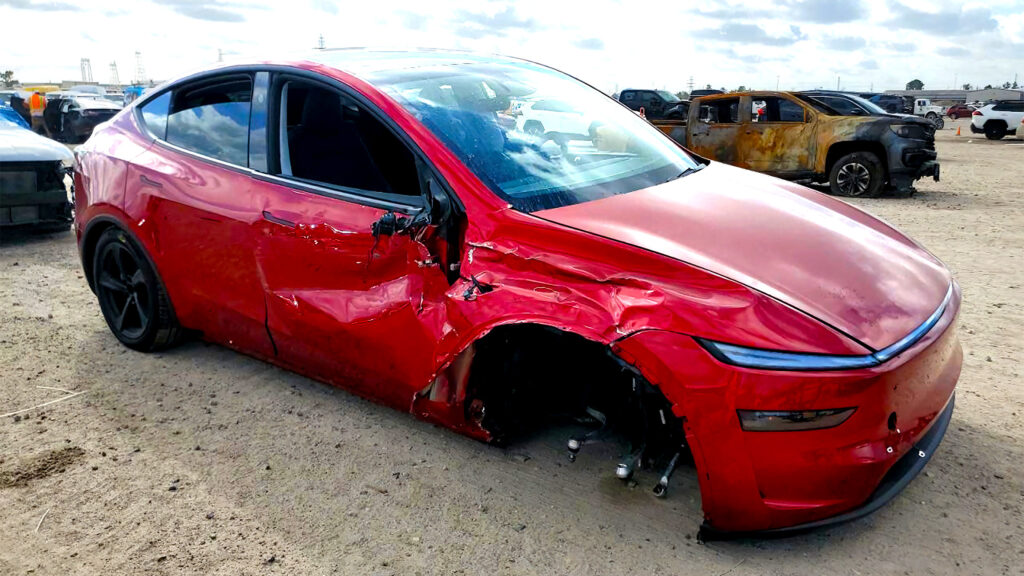
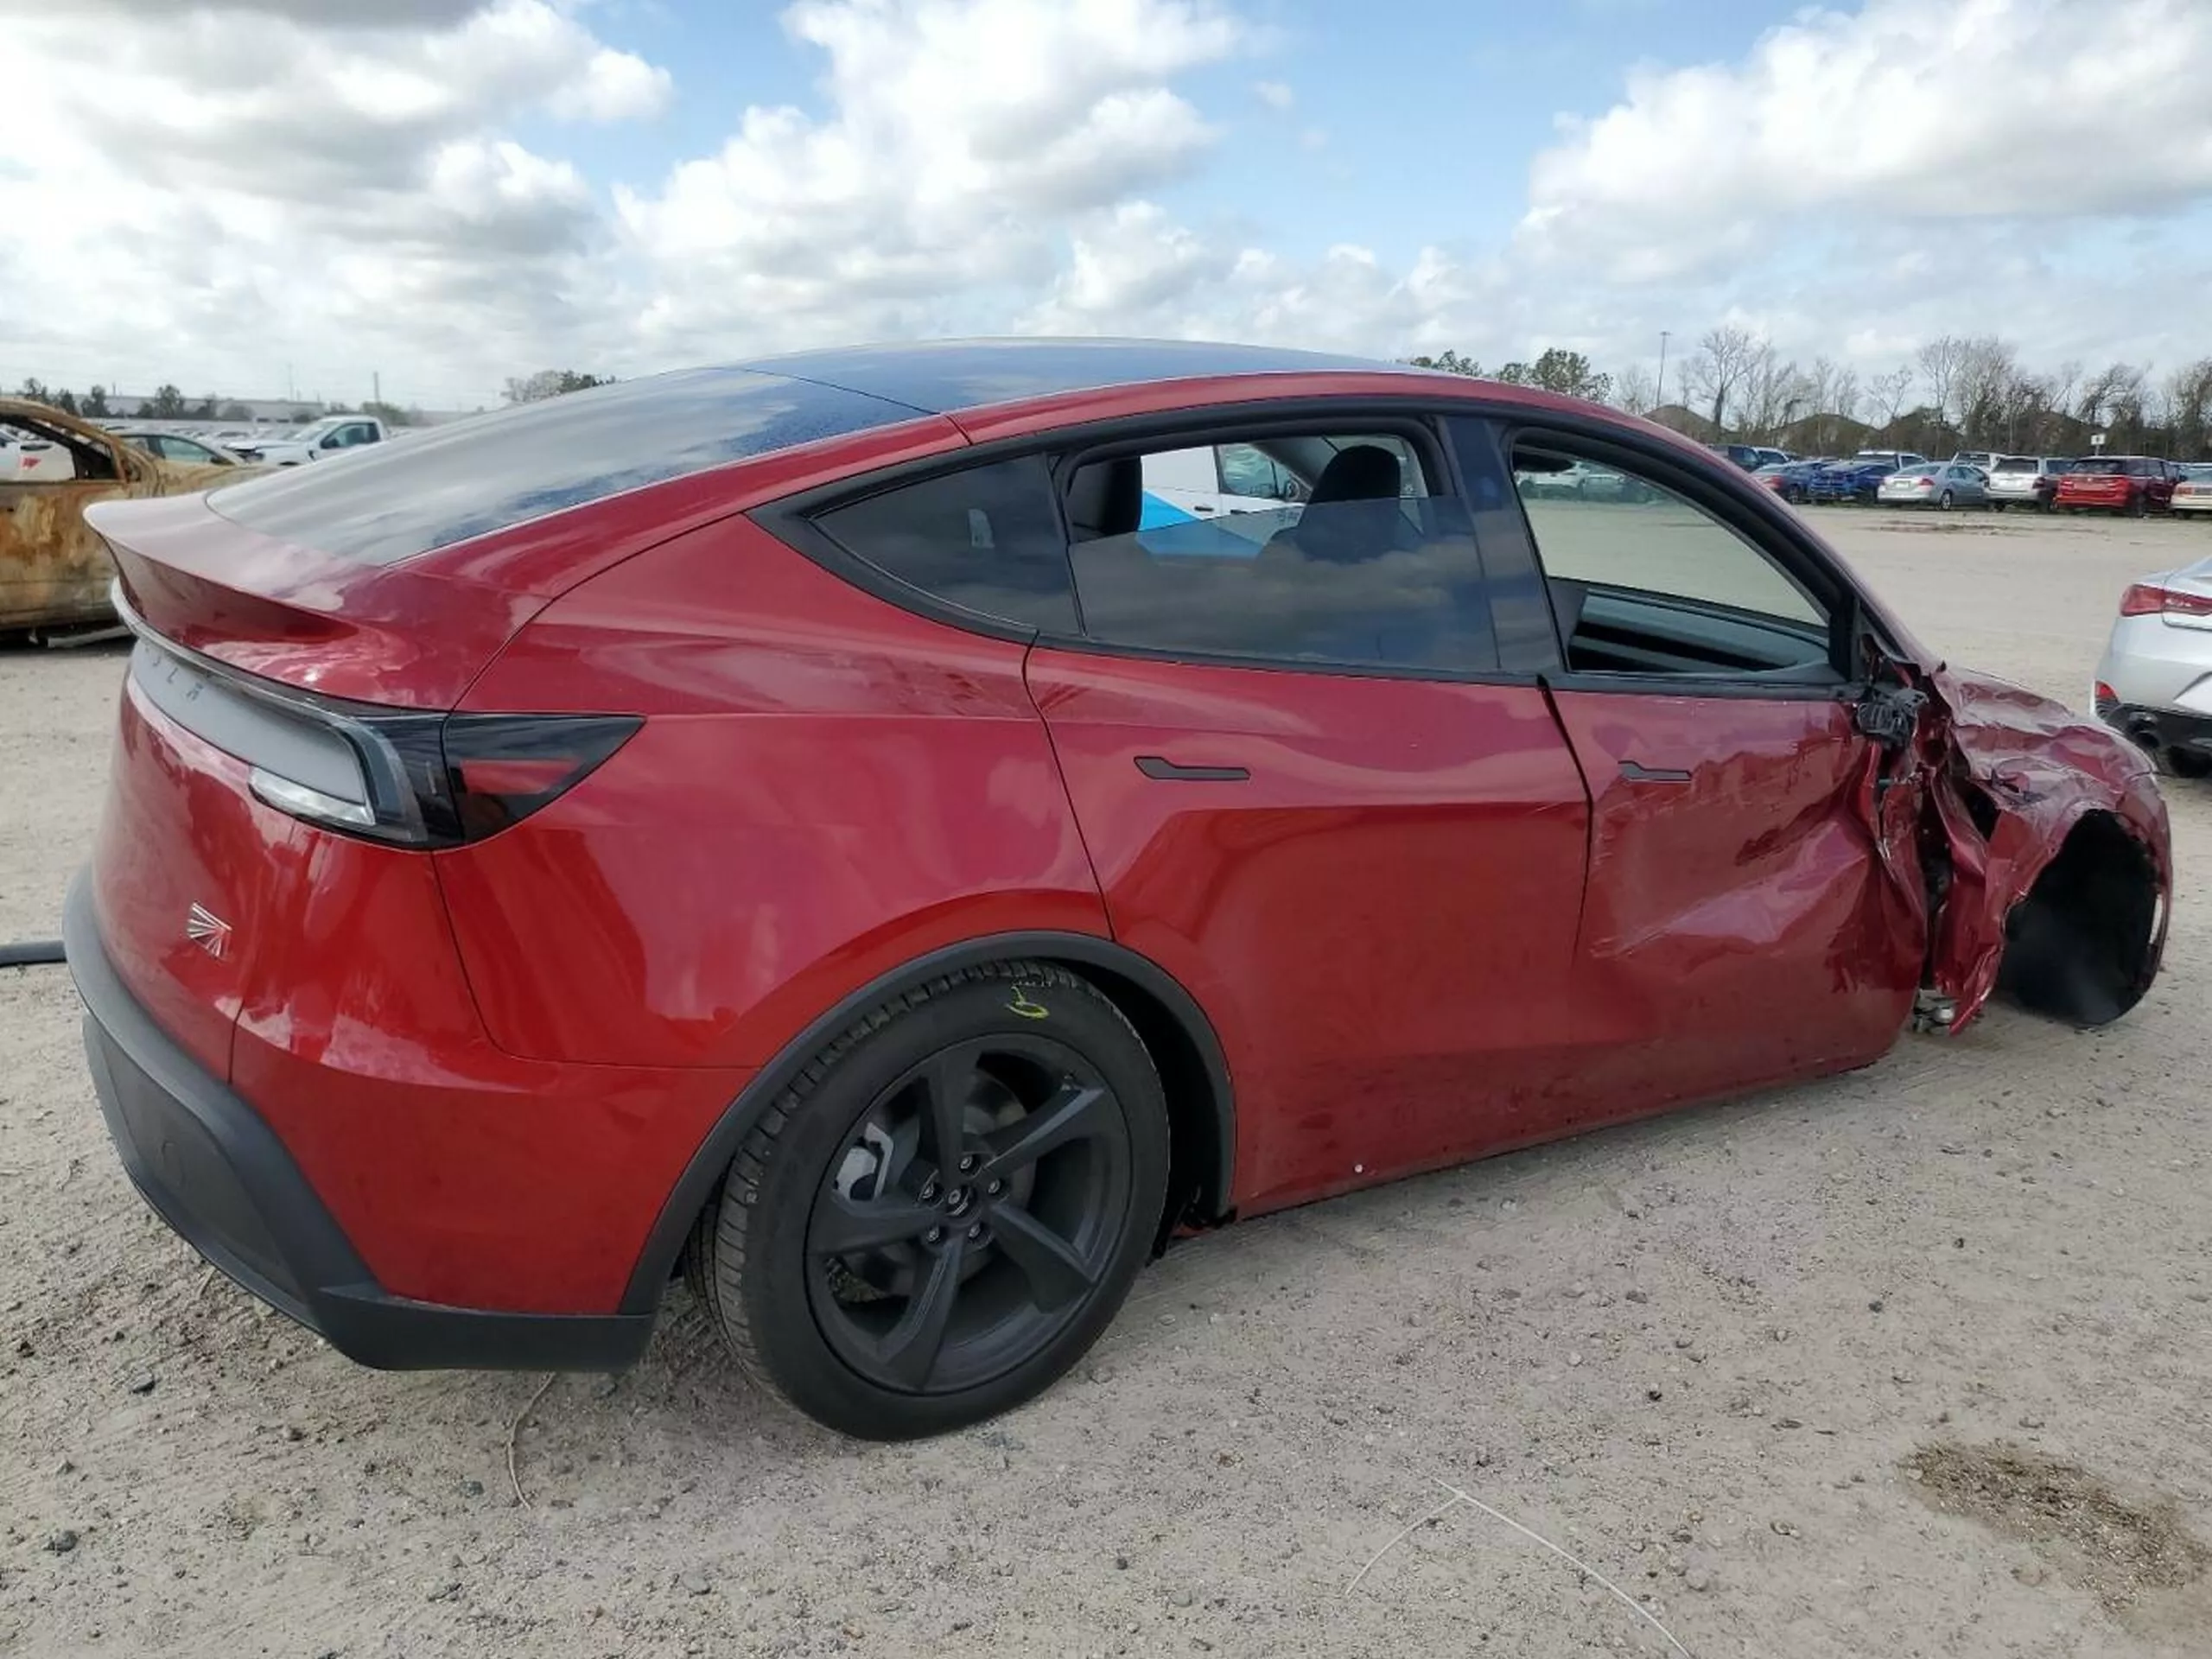
When was the last time you were involved in a fender bender? A few might be lucky enough to have never had an auto accident, and if you want things to stay that way you better give Boston, MA, a hard pass if you’re thinking of toad tripping or relocating to another part of the country. A new study named the city’s drivers the most likely to experience a smash.

var adpushup = window.adpushup = window.adpushup || {que:[]};
adpushup.que.push(function() {
if (adpushup.config.platform !== “DESKTOP”){
adpushup.triggerAd(“0f7e3106-c4d6-4db4-8135-c508879a76f8”);
} else {
adpushup.triggerAd(“82503191-e1d1-435a-874f-9c78a2a54a2f”);
}
});

Related: These Cars And Brands Have The Highest Fatality Rates On US Roads

Bostonians drive on average for just 3.1 years between accidents, according to data from Allstate, compared with 14.2 years for the safest city and a 10.5-year national average. The northeast of the country in general looks like a real life Wreckfest based on the numbers, with Atlantic-facing cities occupying the top five spots.

Next-worst after Boston is Washington, DC, at 3.9 years, followed by Baltimore, MD, (4.2 years), Worcester, MA, (4.3 years) and Springfield, also MA (4.6 years).

LEAST SAFE CITIES FOR DRIVERS
RankCityAvg Years
Between
Crashes
Risk vs
US Avg
2015
Rank
Rank
Chg
1Boston, MA3.07244.00%2000
2Washington, DC3.87172.40%197-2
3Baltimore, MD4.17153.10%1980
4Worcester, MA4.26147.60%1992
5Springfield, MA4.57130.80%1960
6Glendale, CA5.3796.40%194-1
7Los Angeles, CA5.5988.90%191-3
8Oakland, CA5.7583.70%188-5
9Providence, RI5.8779.70%1953
10Philadelphia, PA5.9278.30%1921
Allstate


SWIPE


But the West Coast keeps its bodyshops busy, too. Californian cities Glendale, Los Angeles and Oakland all figure among the worst 10, though Allstate says they’re marginally safer than they were in the equivalent 2025 study.

Which city’s driver’s achieved that incredible 14.2-year gap between bumps? They’re from Brownsville, TX, which beat out second-place Boise, ID, whose drivers last 13.9 years between prangs. Fort Collins, CO, ranks third safest with 13.4 years, Cary, NC, drivers last 12.9 years and those in Laredo, TX, achieved 12.8 years.

SAFEST CITIES FOR DRIVERS
RankCityAvg Years
Between
Crashes
Risk vs
US Avg
2015
Rank
Rank
Chg
1Brownsville, TX14.24-25.90%21
2Boise, ID13.9-24.10%31
3Fort Collins, CO13.36-21.00%41
4Cary, NC12.91-18.30%106
5Laredo, TX12.83-17.70%8-3
6Olathe, KS12.77-17.30%148
7Scottsdale, AZ12.74-17.10%3932
8Port St. Lucie, FL12.46-15.30%1810
9Madison, WI12.35-14.50%6-3
10Eugene, OR12.27-14.00%3525
Allstate


SWIPE


The data comes from insurance claims filed during 2022-23, and is based only on accidents that resulted in property or car damage claims. So it doesn’t take account of minor accidents or how bad those accidents were, meaning it’s not a complete record of all true collisions.

It’s probably still safe to say that you’re more likely to biff your car in Boston than the average city, and if you value your clean insurance record you also might want to steer clear of vacationing Boston-plated cars when driving elsewhere in the US. You can check out Allstate’s full study of 200 US cities below.

 This City Just Got Named The Most Dangerous Place For US Drivers

Photos Copart

var adpushup = window.adpushup = window.adpushup || {que:[]};
adpushup.que.push(function() {
if (adpushup.config.platform !== “DESKTOP”){
adpushup.triggerAd(“bb7964e9-07de-4b06-a83e-ead35079d53c”);
} else {
adpushup.triggerAd(“9b1169d9-7a89-4971-a77f-1397f7588751”);
}
});

RankCityAvg. Years
Between
Crashes
Risk vs
US Avg
2015
Rank
Rank
Chg
1Brownsville, TX14.24-25.90%2+1
2Boise, ID13.90-24.1%3+1
3Fort Collins, CO13.36-21.0%4+1
4Cary, NC12.91-18.3%10+6
5Laredo, TX12.83-17.7%8-3
6Olathe, KS12.77-17.3%14+8
7Scottsdale, AZ12.74-17.1%39+32
8Port St. Lucie, FL12.46-15.3%18+10
9Madison, WI12.35-14.5%6-3
10Eugene, OR12.27-14.0%35+25
11McAllen, TX12.13-12.9%36+25
12Huntsville, AL11.97-11.8%9-3
13Fayetteville, NC11.74-10.1%90+77
14Cape Coral, FL11.63-9.2%5-9
15Overland Park, KS11.59-8.9%32+17
16Gainesville, FL11.55-8.6%NEW ADDITION
17Knoxville, TN11.53-8.4%29+12
18Roseville, CA11.39-7.3%NEW ADDITION
19Chattanooga, TN11.39-7.3%51+32
20Corpus Christi, TX11.23-6.0%58+38
21Gilbert, AZ11.20-5.8%33+12
22Lakewood, CO11.19-5.6%24+2
23Colorado Springs, CO11.10-4.9%16-7
24Lexington, KY11.01-4.1%31+7
25St. Petersburg, FL10.95-3.6%52+27
26Chandler, AZ10.94-3.6%28+2
27Orlando, FL10.94-3.5%75+48
28Amarillo, TX10.88-3.0%23-5
29Jackson, MS10.84-2.6%114+85
30Thornton, CO10.81-2.4%NEW ADDITION
31Jacksonville, FL10.81-2.3%43+12
32Anchorage, AK10.78-2.1%127+95
33Chesapeake, VA10.75-1.8%56+23
34Greensboro, NC10.74-1.7%72+38
35Mesa, AZ10.72-1.5%27-8
36Rockford, IL10.69-1.3%46+10
37Tallahassee, FL10.68-1.1%40-3
38El Paso, TX10.66-0.9%50+12
39Naperville, IL10.65-0.8%100+61
40Durham, NC10.60-0.5%91+51
41Bellevue, WA10.58-0.3%174+133
42Lincoln, NE10.57-0.1%21-21
43Winston-Salem, NC10.550.1%38-5
44Kansas City, KS10.550.1%1-43
45Lubbock, TX10.530.2%53+8
46Virginia Beach, VA10.461.0%93+47
47Fort Lauderdale, FL10.431.2%73+26
48Springfield, MO10.391.6%15-33
49Shreveport, LA10.361.9%87+38
50Peoria, AZ10.322.2%30-20
51Vancouver, WA10.322.3%94+43
52Pembroke Pines, FL10.302.5%111+59
53Fort Wayne, IN10.302.5%22-31
54Salem, OR10.252.9%120+66
55Birmingham, AL10.243.1%20-35
56Wichita, KS10.243.1%11-45
57Akron, OH10.233.2%54-3
58Columbus, GA10.203.5%76+18
59Milwaukee, WI10.173.8%45-14
60Raleigh, NC10.134.2%77+17
61Montgomery, AL10.114.4%13-48
62Clarksville, TN10.114.4%67+5
63Oklahoma City, OK10.065.0%89+26
64Reno, NV10.045.1%12-52
65Mobile, AL10.005.6%25-40
66Aurora, IL9.956.1%65-1
67Surprise, AZ9.916.5%NEW ADDITION
68Tampa, FL9.906.6%131+63
69Toledo, OH9.867.0%48-21
70Tulsa, OK9.837.4%62-8
71Tucson, AZ9.837.4%37-34
72Miami, FL9.738.5%147+75
73Spokane, WA9.738.5%64-9
74Killeen, TX9.679.2%135+61
75Honolulu, HI9.669.3%150+75
76Visalia, CA9.669.3%NEW ADDITION
77Little Rock, AR9.5810.2%130+53
78Joliet, IL9.5610.4%55-23
89Pasadena, TX9.5011.2%99+20
80Murfreesboro, TN9.5011.2%NEW ADDITION
81Elk Grove, CA9.4911.3%78-3
82Hollywood, FL9.4811.4%141+59
83Chula Vista, CA9.4711.4%112+29
84Louisville, KY9.4012.3%69-15
85Augusta, GA9.3712.7%82-3
86Albuquerque, NM9.3612.8%109+23
87Hialeah, FL9.3413.0%125+38
88Memphis, TN9.3413.1%96+8
89Macon, GA9.3313.1%NEW ADDITION
90Bakersfield, CA9.2713.9%86-4
91Oxnard, CA9.2214.4%80-11
92Henderson, NV9.1715.1%57-35
93Charleston, SC9.1615.2%122+29
94Salt Lake City, UT9.1615.2%74-20
95Frisco, TX9.1315.6%146+51
96Omaha, NE9.1215.7%26-70
97Newport News, VA9.1115.9%49-48
98Jersey City, NJ9.0516.7%136+38
99Charlotte, NC9.0217.1%142+43
100Seattle, WA9.0017.3%184+84
101Kansas City, MO8.9817.5%17-84
102Portland, OR8.9717.7%183+81
103Huntington Beach, CA8.9118.5%1030
104Oceanside, CA8.8818.9%126+22
105Columbia, SC8.8818.9%149+44
106Salinas, CA8.8419.3%59-47
107Nashville, TN8.8419.4%83+24
108Des Moines, IA8.8319.6%19-89
109Rancho Cucamonga, CA8.8319.6%66-43
110Tacoma, WA8.8119.9%164+54
111Santa Rosa, CA8.8019.9%104-7
112Waco, TX8.7121.2%106-6
113Grand Prairie, TX8.6921.4%171+58
114Sunnyvale, CA8.6821.6%169+55
115Phoenix, AZ8.6522.1%63-52
116Fremont, CA8.6422.1%172+56
117San Diego, CA8.6222.5%123-6
118McKinney, TX8.5922.8%154+36
119Tempe, AZ8.5723.2%47-72
120Escondido, CA8.5623.3%105-15
121Corona, CA8.5523.4%132+11
122Plano, TX8.5423.7%163+41
123Denton, TX8.5124.0%NEW ADDITION
124Lancaster, CA8.3326.8%44-80
125Sioux Falls, SD8.3226.9%42-83
126Indianapolis, IN8.3127.0%60-66
127Denver, CO8.2827.5%84-43
128Fort Worth, TX8.2727.7%153+25
129San Antonio, TX8.2128.5%137+8
130Aurora, CO8.1729.3%118-12
131Palmdale, CA8.1629.4%68-63
132Riverside, CA8.1629.4%124-8
133Fontana, CA8.1529.6%97-36
134Irving, TX8.1429.6%182+48
135Austin, TX8.1329.9%166+31
136Fresno, CA8.1329.9%98-38
137Santa Clarita, CA8.1130.1%108-29
138Glendale, AZ8.0730.8%61-77
139Norfolk, VA8.0031.9%138-1
140New York, NY7.9932.0%151+11
141Columbus, OH7.9433.0%119-22
142Detroit, MI7.9233.3%110-32
143Arlington, TX7.9033.6%175+32
144San Jose, CA7.8834.0%165+21
145Ontario, CA7.8634.4%79-66
146Cleveland, OH7.8534.4%70-76
147Arlington, VA7.8135.2%175+28
148Rochester, NY7.8035.3%152+4
149Pomona, CA7.8035.3%101-48
150Modesto, CA7.7935.5%107-43
151Mesquite, TX7.7935.6%162+11
152Moreno Valley, CA7.7735.8%92-60
153Stockton, CA7.7735.8%117-36
154Houston, TX7.7536.1%170+16
155Buffalo, NY7.7436.4%157+2
156Chicago, IL7.6937.2%134-22
157Cincinnati, OH7.6937.3%160+3
158Savannah, GA7.6737.6%143-15
159Baton Rouge, LA7.6637.8%145-14
160Minneapolis, MN7.6338.4%81-79
161Richmond, VA7.5839.2%88-73
162Hayward, CA7.5739.5%156-6
163Yonkers, NY7.4940.9%155-8
164San Bernardino, CA7.4841.1%102-62
165Dallas, TX7.4741.4%177+12
166Enterprise, NV7.4641.6%NEW ADDITION
167Paterson, NJ7.4441.8%180+13
168New Orleans, LA7.4441.9%158-10
169Irvine, CA7.4342.0%159-10
170Garland, TX7.4142.4%181+11
171Pittsburgh, PA7.3643.3%185+14
172St. Paul, MN7.3543.6%121-51
173Syracuse, NY7.3044.5%133-40
174Las Vegas, NV7.1847.0%113-61
175St. Louis, MO7.0948.8%85-90
176Santa Ana, CA7.0150.6%139-37
177Sacramento, CA7.0050.7%115-62
178San Francisco, CA6.8653.8%193+15
179Spring Valley, NV6.8454.4%156-23
180Newark, NJ6.8254.7%168-12
181Anaheim, CA6.7955.4%173-8
182Garden Grove, CA6.7955.6%186+4
183Long Beach, CA6.6558.6%148-35
184Paradise, NV6.5561.1%NEW ADDITION
185North Las Vegas, NV6.5361.7%128-57
186Bridgeport, CT6.4264.5%187+1
187Grand Rapids, MI6.4164.7%140-47
188Alexandria, VA6.3267.0%190+2
189Atlanta, GA6.3167.4%179-10
190Sunrise Manor, NV5.9677.0%NEW ADDITION
191Philadelphia, PA5.9278.3%192+1
192Providence, RI5.8779.7%195+3
193Oakland, CA5.7583.7%188-5
194Los Angeles, CA5.5988.9%191-3
195Glendale, CA5.3796.4%194-1
196Springfield, MA4.57130.8%1960
197Worcester, MA4.26147.6%199+2
198Baltimore, MD4.17153.1%1980
199Washington, DC3.87172.4%197-2
200Boston, MA3.07244.0%2000

SWIPE


Leave a Reply

Your email address will not be published.